A label-free optical technology that measures the concentration, size and mass of individual 20 – 300nm particles — no labelling, no calibration, no standards
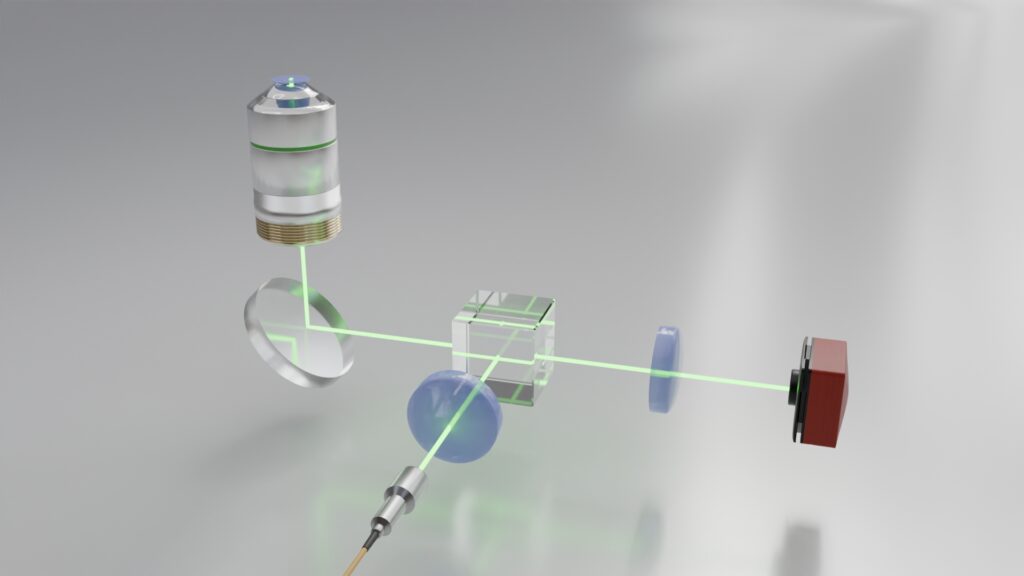
UNVEIL’s technology, called DH-NTA (Digital Holographic Nano Tracking Analysis), is built on an interferometric scattering approach (iSCAT) as its optical foundation: part of a laser beam interferes with the light scattered by each nanoparticle, producing a signal gain of about 1,000 times compared to scattering alone. This amplification is what makes individual biological nanoparticles as small as 20nm visible — a range out of reach for most light-based methods.
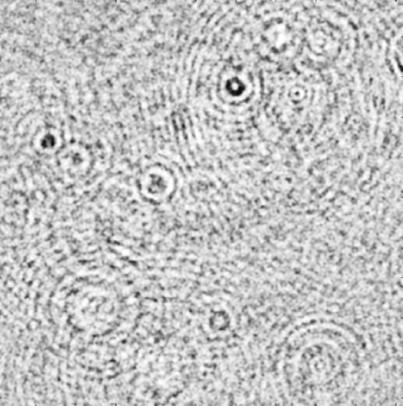
After extensive image processing, the instrument produces movies made of frames like the one below. Each particle appears not as a dot, but as a set of concentric rings of alternating contrast — the interference signature created when the light scattered by the particle combines with the reference beam. Each ring pattern corresponds to a single nanoparticle detected in the field of view. Because these particles are far smaller than the diffraction limit of light, their actual shape can never be imaged — what we record is this interference signature, frame after frame.
What makes DH-NTA unique is the combination of this sensitivity with digital holography, which lets UNVEIL extract three independent, quantitative properties for every single particle it detects:
The definition of concentration is the number of particles per unit volume. Our microscope uses holographic imaging to record 3D images from a small volume within the sample. Our algorithm can explore this volume, count the number of particles and deduce an absolute concentration measurement. Therefore, unlike indirect methods, it does not rely on assumptions about particle shape or refractive index.
The theory of light diffraction states that small nanoparticles (small compared to wavelength i.e., 450 nm) scatter an amount of light proportional to the square of their “polarizability “. Furthermore, this polarizability, for small particles, is proportional to their mass. Therefore, it means that heavier particles scatter more light, and appear brighter on our images. That is why our software measures the brightness of each nanoparticle and deduces its mass.
Every second, 1,000 “3D snapshots” of individual nanoparticles are generated by our instrument. Our software automatically performs single-particle tracking and reconstructs their trajectory. The analysis of each trajectory enables to derive an hydrodynamic diameter for each particle. Finally, this output is used to build the 2- dimension hydrodynamic diameter distribution.
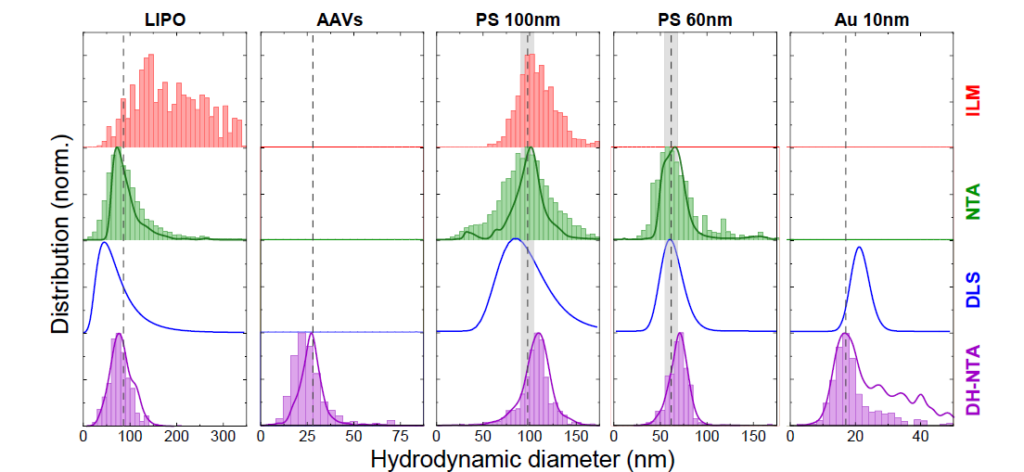
Because UNVEIL measures each particle individually rather than averaging over the whole sample, it achieves finer size resolution and higher sensitivity than bulk or single-parameter methods. Measured side by side on the same samples, our DH-NTA approach resolves smaller and more heterogeneous particles — such as AAVs and lipid nanoparticles (LNPs) — than NTA, DLS and interferometric light microscopy (ILM).
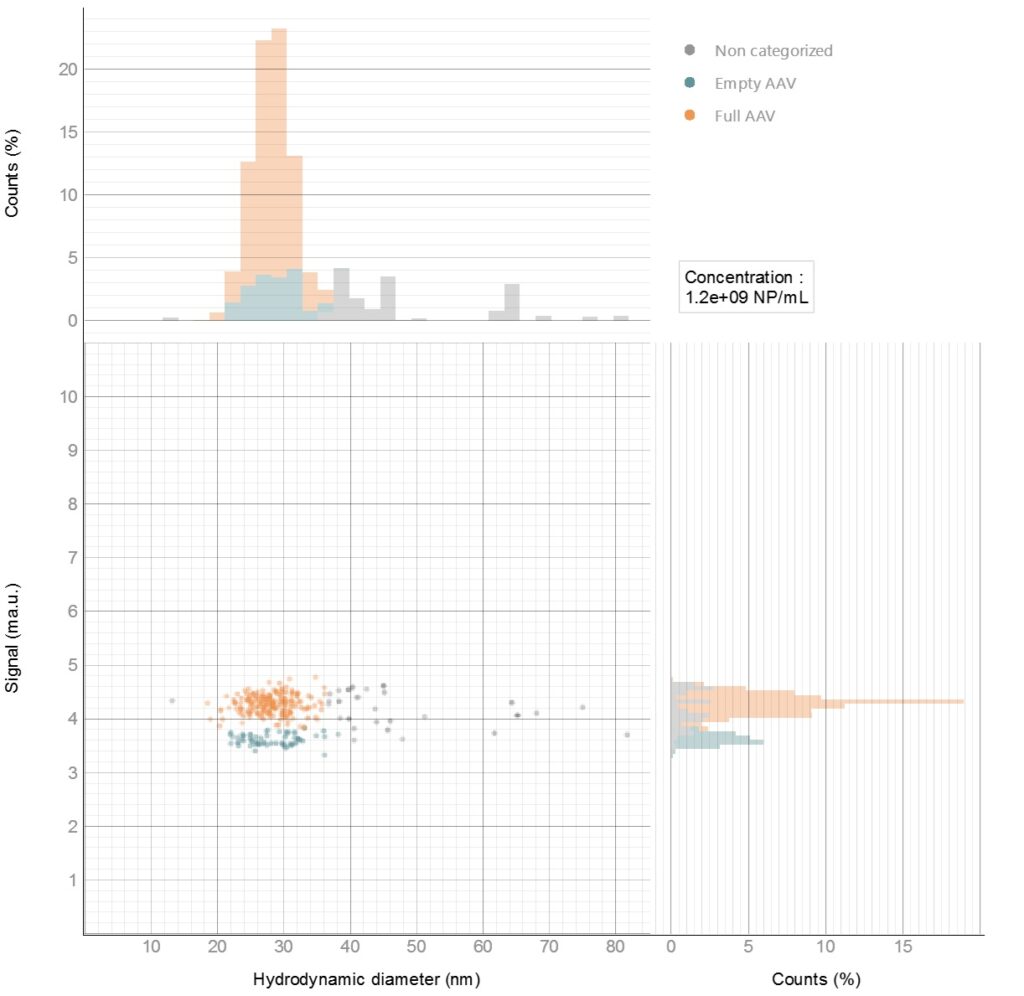
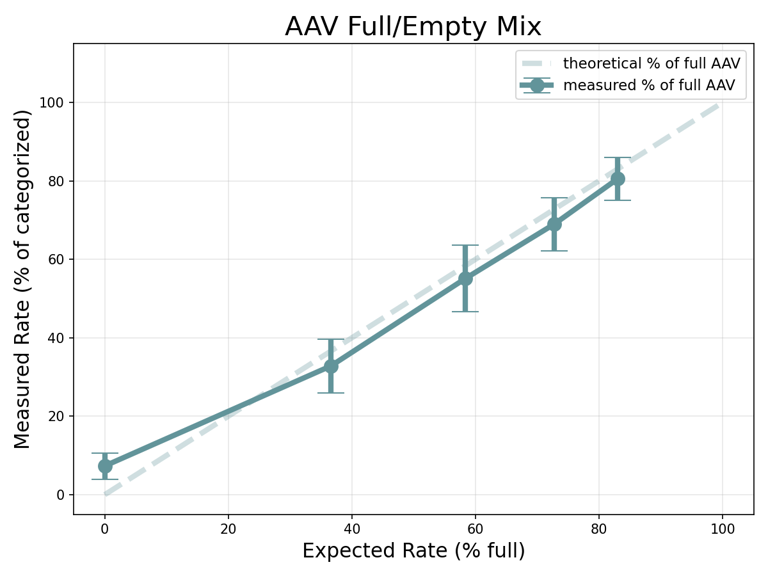
Measuring the mass of each particle adds a dimension that size alone cannot provide: it separates populations of similar size but different content. On AAV samples, UNVEIL distinguishes empty and full capsids and gives the concentration of each.
Additionally, these full/empty ratios match the expected values of reference samples.
Characterize your own samples — yield, empty vs full, aggregation — in minutes: